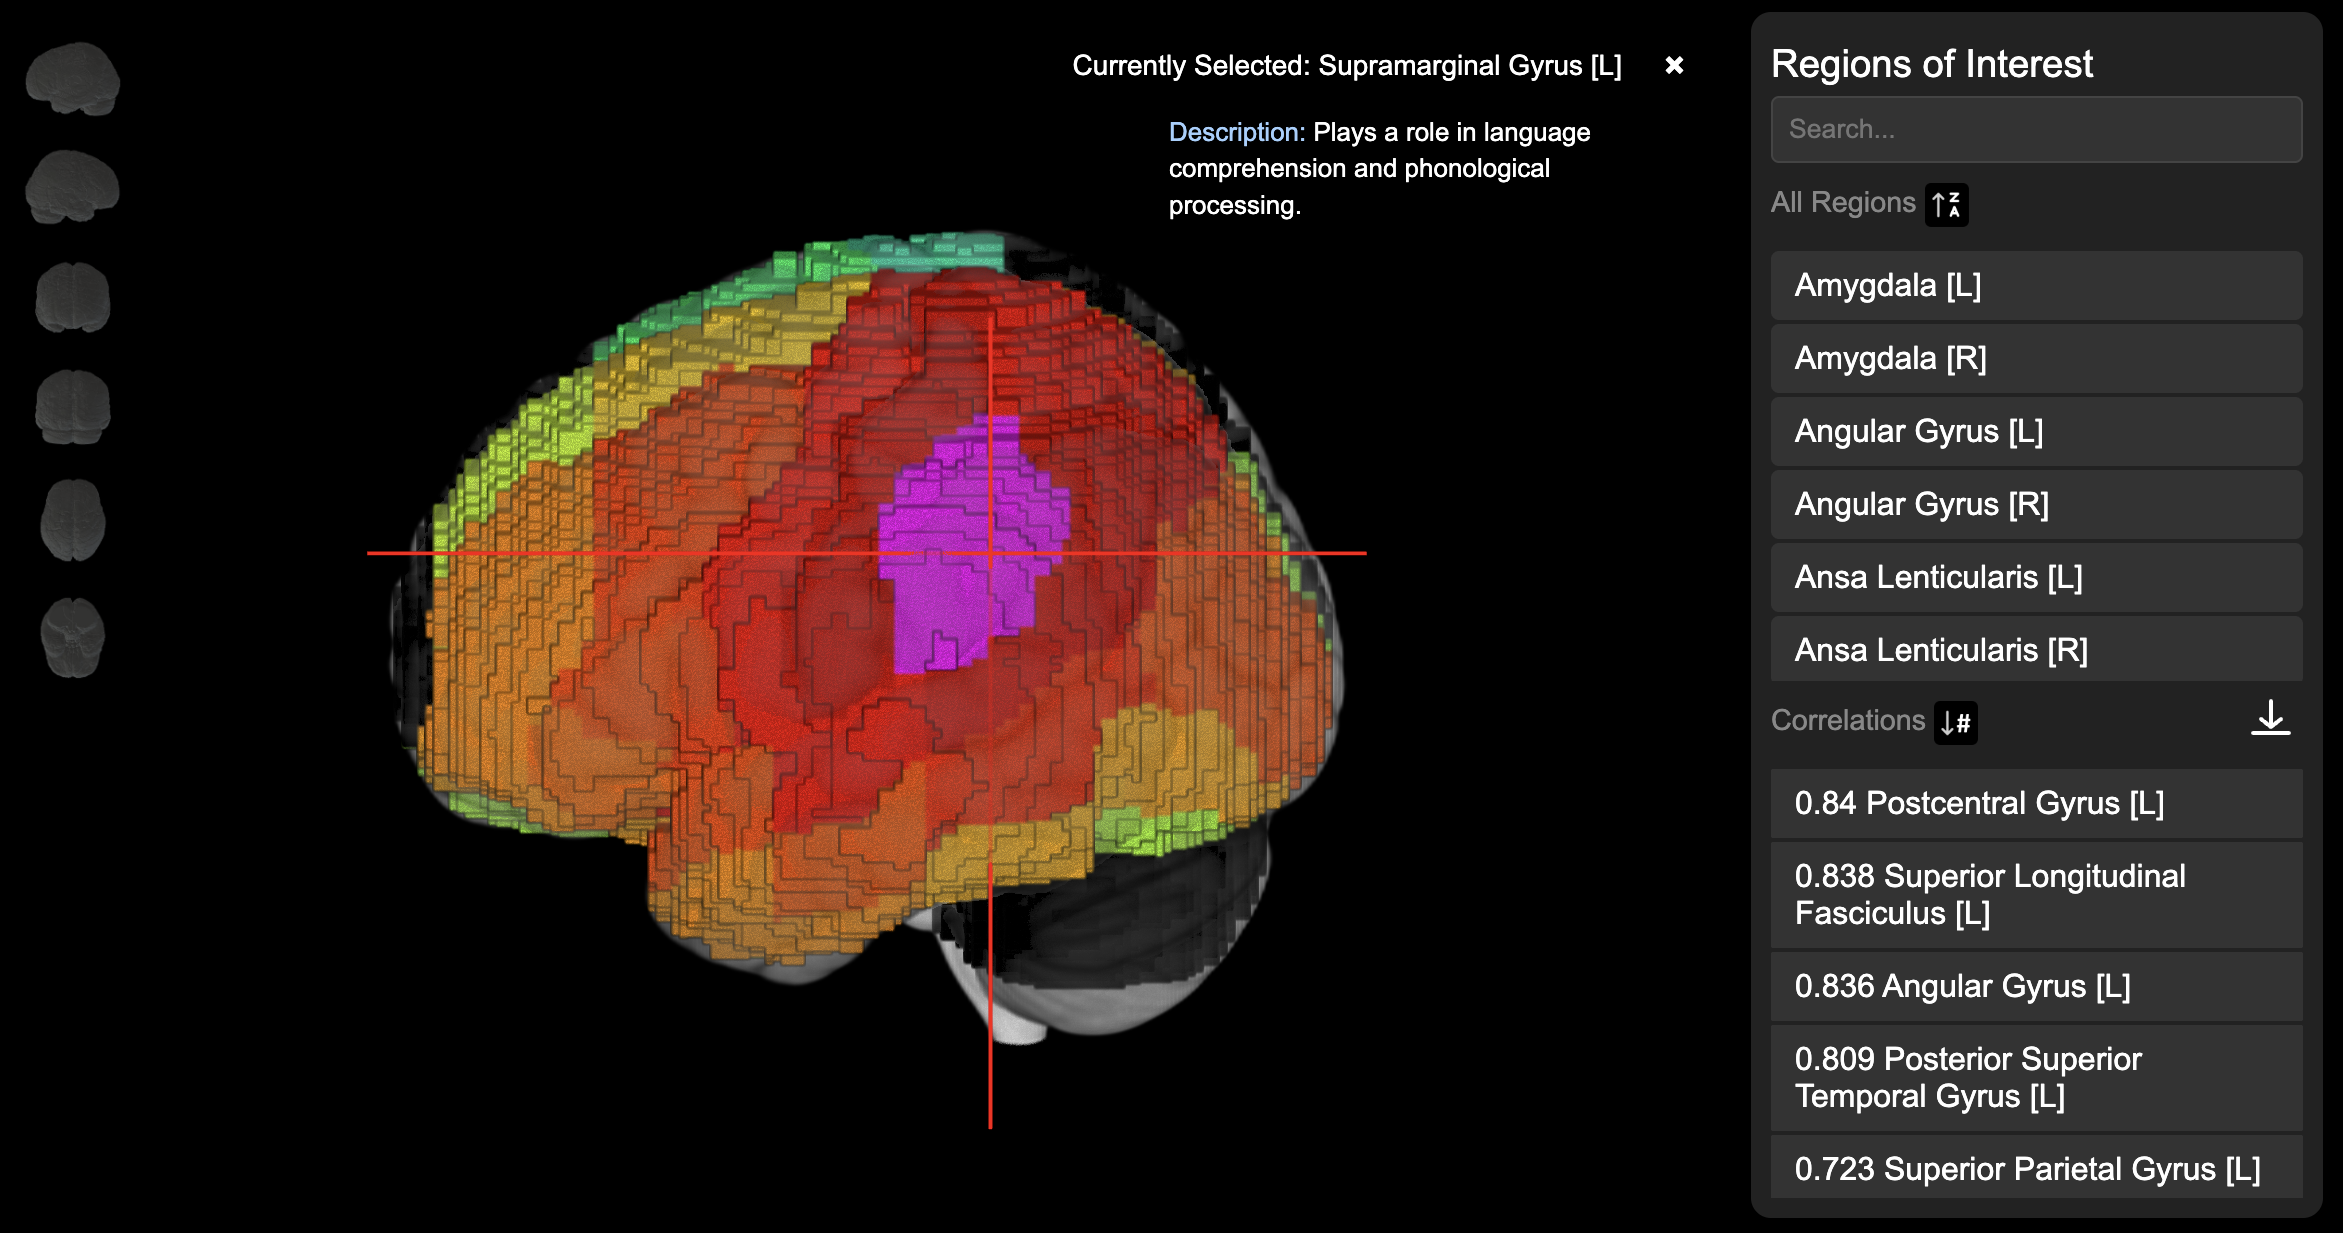
Stroke Cluster Visualization
Are you ready to take your research up a notch? Watch our video to get an inside look at our cutting-edge web app for visualizing stroke research.
Welcome to the Stroke Cluster Visualization. Discover how our web app can help you enhance your stroke research with complex correlations in Dr. Rutvik Desai's patients through interactive visualizations. Our design features 2 atlases, 3 colorblind modes, and data visualized from over 500 MRIs.
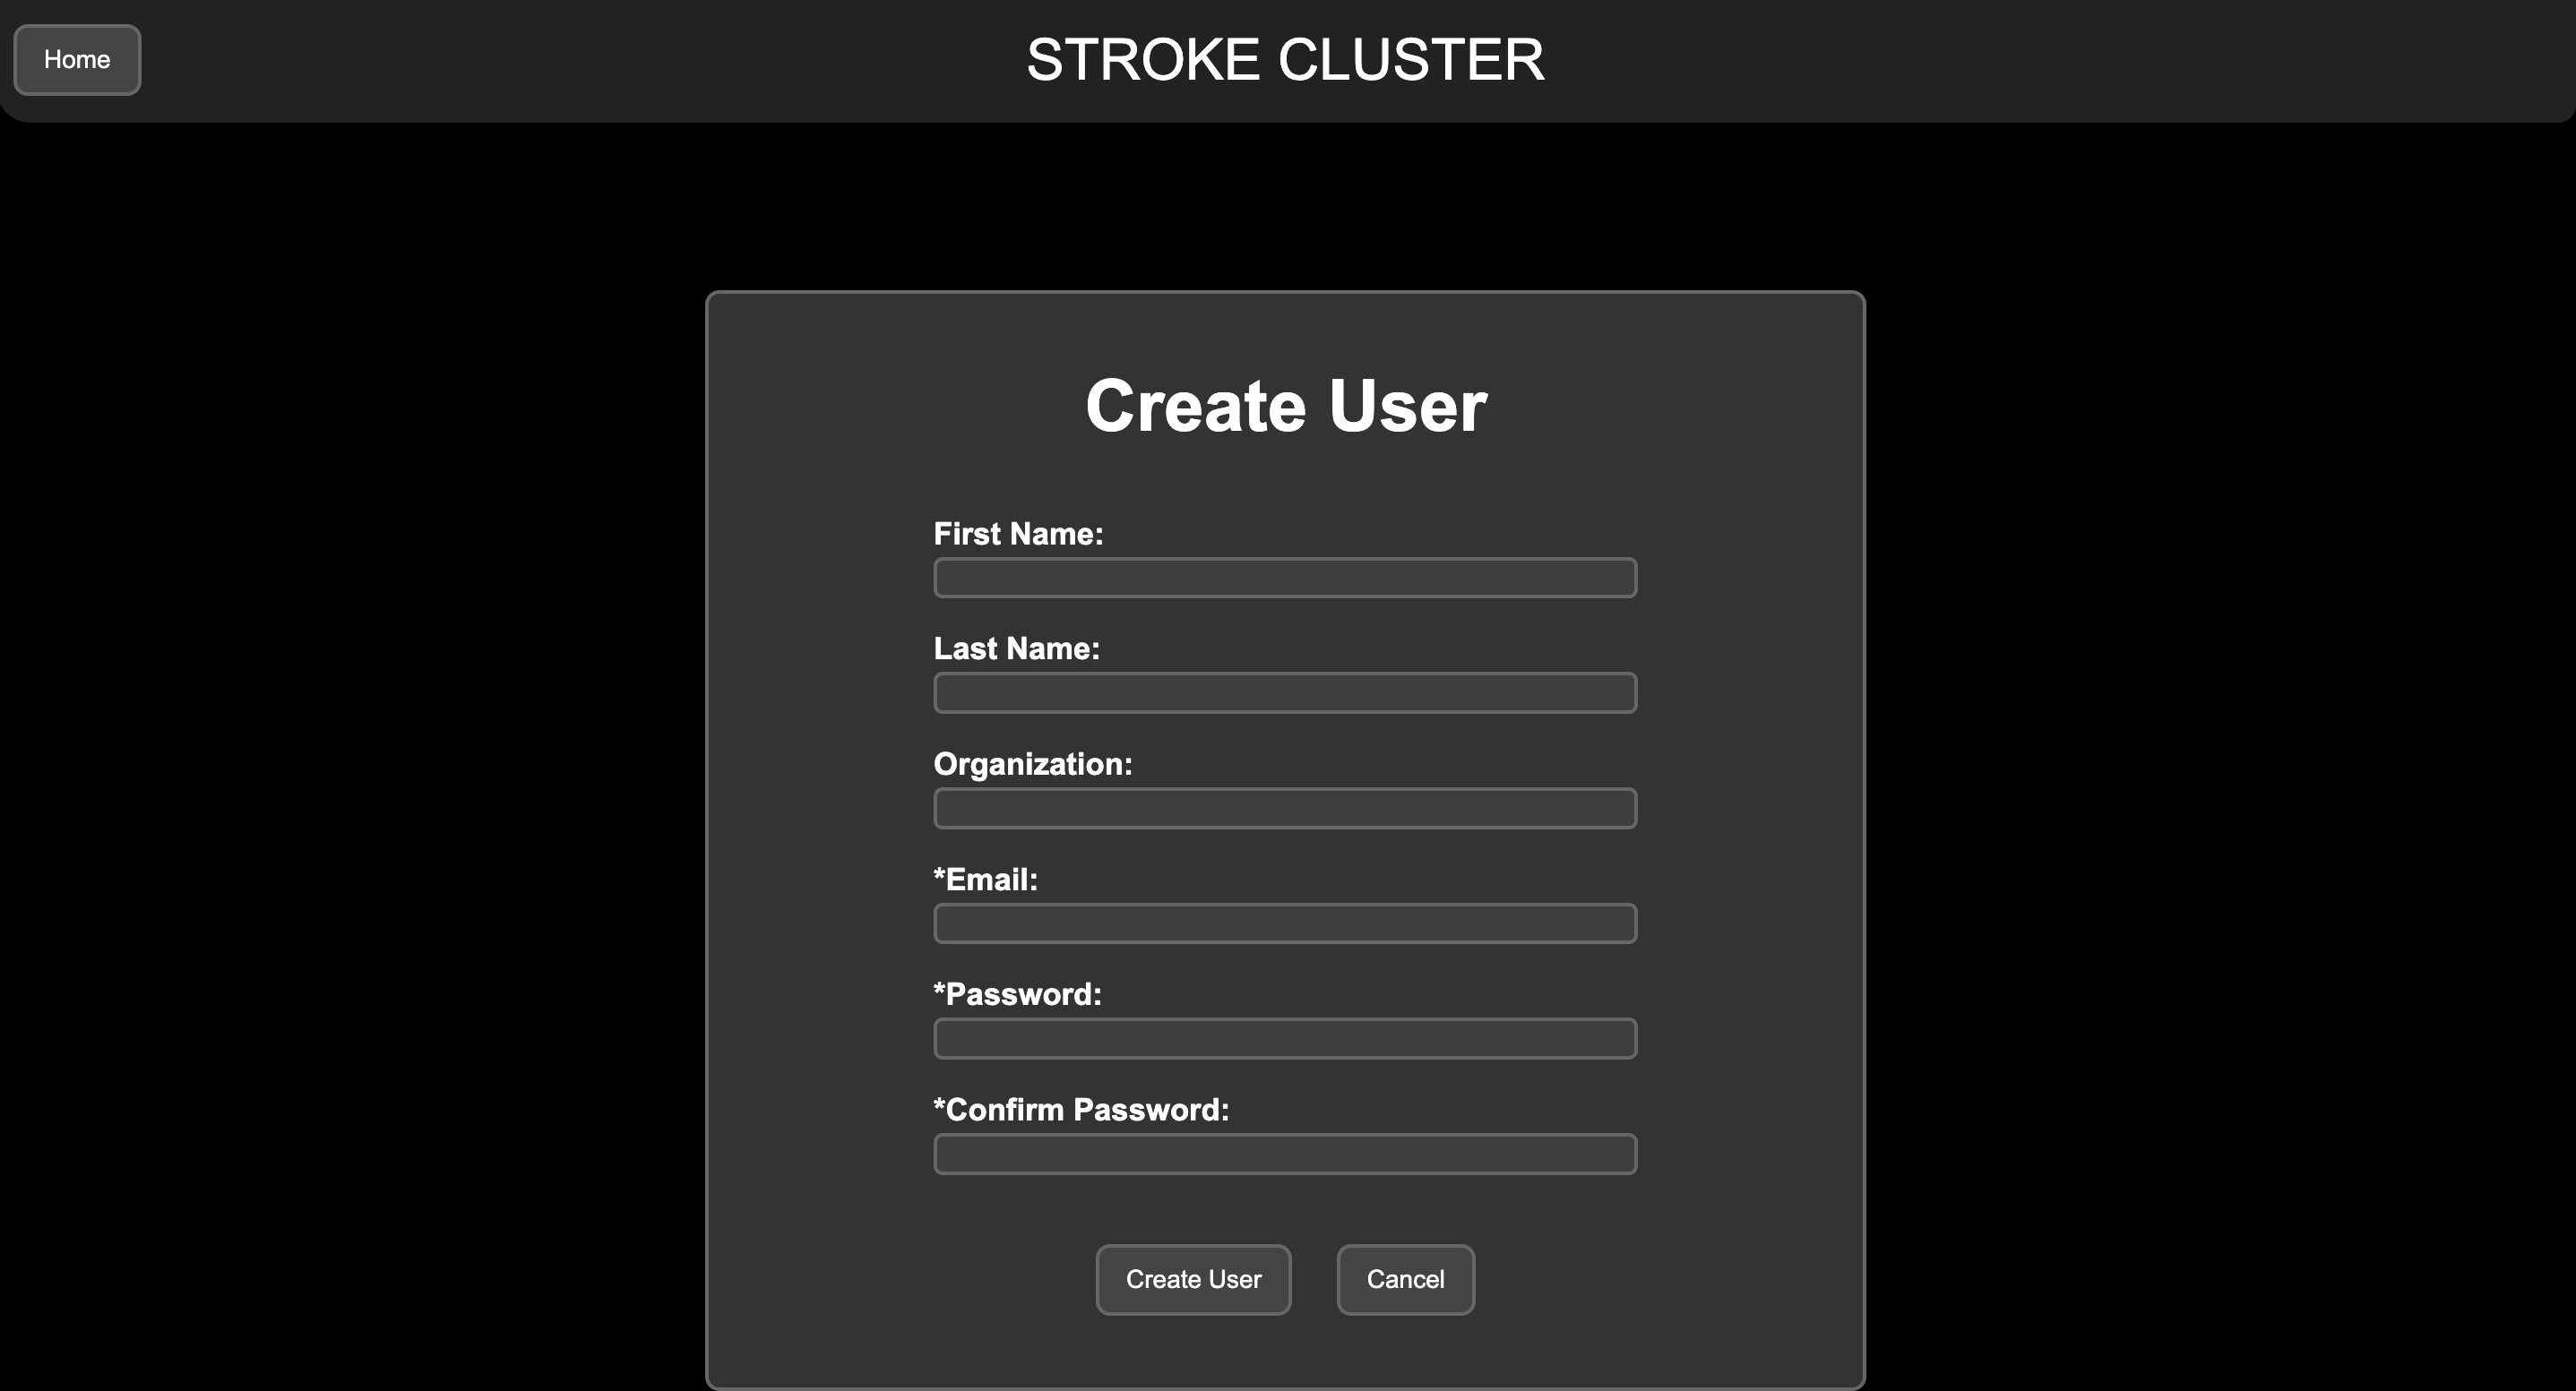
Most importantly, researchers can create an account and securely upload their own marked lesion data to display custom correlation visualizations.
Screenshots & Demos